![]()
I finished a Normal Distribution Blanket for my new little nephew, Martin!
This is the same idea I used to make a blanket for my little niece Kara, but that one was in shades of pink.
Unfortunately, I didn’t get to try the blanket out on Martin in person, but I gave the blanket to my brother, his Daddy, to give to Martin.
Here’s the method. The blanket is simply a series of entrelac squares (diamonds). I knit one row of squares in one direction, then pick up stitches along an edge to make another row of squares in the other direction, and knit back and forth, with squares in between the squares of the previous row. The nice thing about it is that each square is knitted completely before you move on to the next square, so you don’t have to carry different yarns across the row.
I used Tahki’s Cotton Classic yarn because they have many, many shades, and I already had some spare yarn from previous projects — Cotton Classic is my go-to yarn for mathematical knitting projects. All those shades!
Choosing the shade of the yarn for each square is where the normal distribution math comes in.
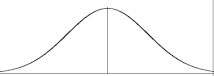 I simply generated a list of random numbers from the normal distribution (using google to find a random number generator). The normal distribution is a bell-shaped curve, so I’ll get more numbers in the middle of the distribution.
I took five shades of purple and labeled them A through E. For numbers in the middle, I used lighter colors, and got gradually darker as the numbers went out from the middle. For numbers that were outliers, I added a sparkly silver yarn to color E — because it’s the outliers that make life beautiful. And aren’t we all outliers in some way?
Here’s the specific math for those who care or who want to reproduce the method:
I set the middle of the distribution as zero, with a standard deviation of one. For positive numbers, I did a garter stitch square, and for negative numbers I did a seed stitch square.
Here’s how I assigned the colors:
Color A: Absolute values between 0 and 0.5
Color B: Absolute values between 0.5 and 1.0
Color C: Absolute values between 1.0 and 1.5
Color D: Absolute values between 1.5 and 2.0
Color E (with sparkles!): Absolute values greater than 2.0
Now, I didn’t have a perfect progression from light to dark. Color D was the reddish purple. And it’s not obvious in the photo that E was definitely much darker than Color C. Making D the reddish purple seemed to get the weight of the colors to progress better. I should have done a close-up of the sparkles, but didn’t think of it this time.
One thing I like about visualizing a normal distribution this way is you get a more visceral feel for how the colors are distributed than just looking at the curve. There are almost as many B-colored squares as A squares — and there really are a lot of outliers. (It might be a better representation if I had gone out one more level and used six colors. But this worked.)
I’ve also done scarves this way (with stripes) and of course the pink blanket. And it always comes out pleasing to the eye. The normal distribution really is the way so much of nature is arranged.
You can find links to explanations of all my mathematical knitting at sonderbooks.com/sonderknitting!