Review of Butterfly Counting, by Jerry Pallotta

butterfly_counting_largeButterfly Counting

by Jerry Pallotta
and Shennen Bersani

Charlesbridge, 2015. 32 pages.
Starred Review

I’ll admit, I am already a huge Jerry Pallotta fan. Why? Because 27 years ago, The Bird Alphabet Book was one of the very first books my child loved. We read it so often, she could recite whole paragraphs from the book with her cute toddler voice. Phooey, 27 years later, I can recite whole paragraphs from the book. (I especially remember, “Wait a minute, bats are not birds! Although they have wings and can fly, bats are mammals…. Get out of this book, you bats!”)

This book does a little of that playing with the reader as well. It starts with a spread of 20 moths. After counting them,

But wait . . . these are not butterflies! These are all moths. We tricked you! Moths can be very colorful.

Then it goes on to count butterflies of different varieties. The first ten butterflies are red, blue, green, purple, orange, black, white, pink, yellow, and brown. The next nine are multicolored and patterned butterflies. Then for 20 to 25, they look at the lifecycle of the butterfly, beginning with twenty Pipevine Swallowtail butterfly eggs.

Each page tells us the word for butterfly in another language. And the book is full of facts about the different varieties of butterflies.

And the book is so beautiful! The illustrator has made stunning paintings of each variety of butterfly (or moth).

It’s so easy for me to imagine a small child, like young Jade, avidly learning and reciting these facts.

The last page shows a lovely creature with wings that go from yellow to bright pink.

A butterfly in Great Britain is called a butterfly. But don’t be silly! This is not a butterfly. It is a grasshopper. Should we write a grasshopper book next?

jerrypallotta.com
shennenbersani.com
charlesbridge.com

Buy from Amazon.com

Find this review on Sonderbooks at: www.sonderbooks.com/Childrens_Nonfiction/butterfly_counting.html

Disclosure: I am an Amazon Affiliate, and will earn a small percentage if you order a book on Amazon after clicking through from my site.

Source: This review is based on a library book from Fairfax County Public Library.

Disclaimer: I am a professional librarian, but I maintain my website and blogs on my own time. The views expressed are solely my own, and in no way represent the official views of my employer or of any committee or group of which I am part.

What did you think of this book?
Review of The New York Times Book of Mathematics, edited by Gina Kolata

ny_times_book_of_mathematics_largeThe New York Times Book of Mathematics

More than 100 Years of Writing by the Numbers

edited by Gina Kolata
Foreword by Paul Hoffman

Sterling, New York, 2013. 480 pages.

If you’re at all interested in mathematics, this is a fascinating book covering the history of major developments in mathematics in the twentieth century and the start of the twenty-first, as told in the pages of The New York Times.

Since the articles are from The New York Times, they are written for the general public, and the articles aren’t too lengthy. I mostly read one a day for a very long time. Incredible as it may seem, the book was never on hold when I wanted to renew it.

My only complaint was that I had to learn to check the date – given at the end of each article – before reading the article rather than after, because all are reported as happening in the present – it was nice to know when the major development had actually happened in 1936 (though there are more from recent years than going that far back).

Of course, having once been in a PhD program in Mathematics (though I settled for my Master’s), I was extra interested to get tastes of what’s going on before and after my time in the math department. For me, it was interesting to place the articles as before or after my time at UCLA.

The articles are grouped in chapters of related articles. You’ll get an idea of what to expect from the chapter titles: “What Is Mathematics?”; “Statistics, Coincidences and Surprising Facts”; “Famous Problems, Solved and As Yet Unsolved”; “Chaos, Catastrophe and Randomness”; “Cryptography and the Emergence of Truly Unbreakable Codes”; “Computers Enter the World of Mathematics”; and “Mathematicians and Their World.” Try this book for a bird’s-eye view of that fascinating world.

sterlingpublishing.com

Buy from Amazon.com

Find this review on Sonderbooks at: www.sonderbooks.com/Nonfiction/ny_times_book_of_mathematics.html

Disclosure: I am an Amazon Affiliate, and will earn a small percentage if you order a book on Amazon after clicking through from my site.

Source: This review is based on a library book from Fairfax County Public Library.

Disclaimer: I am a professional librarian, but I maintain my website and blogs on my own time. The views expressed are solely my own, and in no way represent the official views of my employer or of any committee or group of which I am part.

What did you think of this book?
Prime Factorization Coloring Sheets

I’ve posted several Prime Factorization Coloring Sheets on my Sonderknitting page lately.

I decided I should try coloring them myself, so I could post a thumbnail of each one. I had a lot of fun doing it, and was reminded of lots of cool properties I discovered from knitting my prime factorization sweater and looking at these charts.

I have a manuscript for a math-related children’s nonfiction book about using math to make codes with colors. Originally, I put several of these charts into the book — but I eventually decided it was a distraction and decided to put them on my website instead.

But they show all sorts of cool things!

First, there’s the ten-by-ten prime factorization chart using ordinary, decimal numbers.

pf_chart_hand_colored_for_blog

Coloring this chart gives you a great feeling for factorization and multiples. I posted about watching a second grader color it. I think of it as more for older kids, who are learning about primes and multiples, or indeed adults, in keeping with the adult coloring book craze. But watching a second grader color it assured me that it can give insights to anyone. (I made the instructions such that you don’t even have to know how to multiply. Just color every second square the color for 2, every third square the color for 3, and so on.)

Now, in my original sweater, I put rows of 8 on the back and rows of 2 and rows of 3 on the sleeves. The prime factorization charts in different bases are the same idea.

First, they give you a feeling for how different bases work.

Here’s the sheet for octal, base 8:

octal_chart_hand_colored_for_blog

You can color it exactly the same way as you did the ten-by-ten chart. Color every second square with the color for 2, every third with the color for 3, and so on. If you take the time to do that, you’ll grasp how the numbers count up to 7 and then use the next digit, since place value in octal gives the ones digit, the eights digit, and the sixty-fours digit.

The chart also makes a good way to translate between octal and decimal. (Though you can just multiply the eights digit times eight and add the ones digit.)

But I enjoy some of the other patterns.

The first, most obvious pattern is that in the decimal chart, the multiples of 5 and the multiples of 2 line up vertically (as well as the multiples of 10, which are both). That’s because 10 = 2 x 5.

In the octal chart, the multiples of 2 line up vertically, since 8 = 2 x 2 x 2. So do the multiples of 4 — each with two factors of 2, and the multiples of 8 — each with three factors of 2.

In the Base 6 chart, as you’d expect, the multiples of 2 and the multiples of 3 line up vertically. (And the multiples of 6, with a factor of 2 and a factor of 3, do as well.)

base_six_hand_colored_blog_size

But it’s also fun what happens to the color for Base Plus One and Base Minus One.

In the 10×10 chart, look at what happens to the color for 11, orange, and the multiples of 11. They go diagonally to the right up the chart: 11, 22, 33, 44, . . .

In the 10×10 chart, 9 is represented by two sections of blue, for 3 x 3. These colors go diagonally up the chart in the opposite direction: 9, 18, 27, 36, . . .

In the 8×8 chart, the octal number 11 is the decimal number 9 — so it is still represented by two sections of blue. But since 9 is one bigger than our base in that chart, the two sections of blue go diagonally up the chart to the right — just like 11 in the decimal chart.

In the octal chart, the color for 7, purple, goes diagonally up the chart to the left, with the octal numbers 7, 16, 25, 34, . . . .

In the 6×6 chart, we’ve got the same patterns, this time with 7 (which is 11 in base six) and 5.

7 (purple) goes diagonally right up the chart, and 5 goes diagonally left up the chart.

And we’ve got the same patterns in a 7×7 Base Seven chart:

base_seven_hand_colored

Notice that since 7 is prime, no colors line up except purple, the color for 7.

And the colors for 8 and 6 go diagonally up the chart.

The Hexadecimal chart in base 16 is even more interesting:

hex_hand_colored_blog_size

Notice how all the multiples of 2 line up vertically, with multiples of 4, 8, and 16 also lined up.

11 in Base 16 is decimal 17, which is brown, and it acts like all the other 11s, going diagonally up and to the right.

1 less than 16 is F = 15, and the blue and green colors for F go diagonally up and to the left.

Before I finish I want to mention one more pattern I noticed from looking at these charts. It’s the familiar trick in Base 10 of the rule for figuring out if any number is a multiple of 9: Just add up the digits, and they will be a multiple of 9.

The reason this works is that 10 is congruent to 1 mod 9.
In base 10, each decimal place represents a number multiplied by a power of 10.
In base 9, that’s going to be the same as multiplying by 1 — so if you add up the digits, you get what the number is congruent to mod 9.

If none of that made any sense to you, just know this:
If you add up the digits of a base 10 number (and if you get a number bigger than 9, add them up again), your result is the remainder you’ll get if you divide the number by 9.

Since multiples of 9 have no remainder when divided by 9 — the digits of multiples of 9 in base 10 always add up to multiples of 9. (And by the same reasoning, the digits of multiples of 3 in base 10 always add up to multiples of 3.)

But you might have noticed when looking at the diagonal colors:

In Base 8, the digits of multiples of 7 always add up to multiples of 7.

In Base 6, the digits of multiples of 5 always add up to multiples of 5.

In Base 7, the digits of multiples of 6 always add up to multiples of 6.
And the digits of multiples of 2 always add up to multiples of 2.
And the digits of multiples of 3 always add up to multiples of 3.
(Use the colors to tell which numbers these are in Base 7.)

In Base 16, the digits of multiples of F (15) always add up to multiples of F.
And the digits of multiples of 5 always add up to multiples of 5.
And the digits of multiples of 3 always add up to multiples of 3.
(Use the colors to tell which numbers these are in Base 16.)

Forgive me, but I think these patterns are Awesome!

Let’s face it, you’ll see them much more clearly if you color the charts yourself!

Download the coloring charts at Sonderknitting!

Happy Coloring!

Coded Affirmations Scarf

affirmations_scarfThe one knitted object in my Sonderknitting Mathematical Knitting Gallery which I haven’t explained is the Coded Affirmations Scarf.

I knitted the scarf with a small ball of leftover yarn before I knitted Alyssa’s Coded Blessing Blanket, but after it had occurred to me that you could use mathematical bases to make coded messages, as in this Base Six Code Coloring Sheet. With knitting, instead of colors, you use a different two-stitch stitch pattern for the code.

I’m pretty sure I used a similar code for the Affirmations Scarf as I did for the Blessing Blanket later. The patterns would have involved knit and purl stitches, cables to the front or back, and yarn overs with decreases. But to be honest, the scarf is much harder to read because it’s not as clear where the letters begin and end. (It was nice in the blanket that I had a built-in grid to use.)

Anyway, the idea wasn’t to be able to decipher it. The idea was that I would know what the scarf said.

What does the scarf say? My name — my full name, my nickname — and words that I believe describe me. (Along the lines of “Loved,” “Joyful” — you get the idea.)

And the effect is just a seemingly random lacy pattern.

This was my first experiment. And looking at it now, years later — well, I still haven’t been able to decipher it. (I’m hoping I wrote down the code somewhere!)

But the idea — to knit meaning into a scarf with a coded message — was a complete success.

And I still say you could do this with colors on the edge of a picture or anywhere else you want a secret meaning hidden in a pretty pattern.

coded_affirmations_scarf

My posts on Mathematical Knitting and related topics are now gathered at Sonderknitting.

Normal Distribution Coloring Sheets

I’ve made a Normal Distribution Coloring Sheet and posted it in my Mathematical Knitting Gallery, Sonderknitting.

I thought it would be fun to talk more about it and show some examples.

The reason it’s in my Mathematical Knitting Gallery is that the idea began with knitting.

First, it was my Probability Scarf. I read this idea somewhere. Just choose six colors that look good together. Knit the scarf lengthwise. Assign the numbers 1 through 6 to the six colors. For each row, roll a die to decide which color to use on that row. Flip a coin to decide whether to knit or purl.

Here’s how that scarf came out:

Probability_Scarf

But in this scarf, all the colors are equally likely. This is called a uniform distribution. What if the colors were chosen from a normal distribution, a bell-shaped curve? That’s what I did with Jade’s Outliers Scarf, using bright colors for the outliers, plainer colors for the middle of the curve.

OutliersScarf

But then I thought it would be fun — and much, much quicker — to do this with colored pencils or crayons. So I made a coloring sheet that is just a grid. But the instructions explain how to use random numbers chosen from a normal distribution to color the sections in the grid.

The scarf used three colors, plus a rainbow yarn for the outliers. I decided to use four shades of colored pencils: dark blue for within half a standard deviation of the mean, dark purple for between one-half and one standard deviation, green for one to one and a half standard deviations, and light blue for one and a half to two standard deviations from the mean. Then I used a red marker for the outliers more than 2 standard deviations out from the mean. (I may try this in a scarf, so it was nice to check how it looks first.)

Here’s how it turned out:

normal_distribution_hand_colored_small

Since a lot of characteristics in people or in nature have a normal distribution, this gives a good feel for how people vary. It also explains why the outliers might feel like oddballs. And why one outlier might have a hard time finding another like themselves. But don’t change, outliers! You are what makes life beautiful!

I’m still going to try some other color schemes. I’m thinking it might be time to buy some colored pencils with more shades.

But meanwhile, it occurred to me that I could get more shades if I used computer coloring.

My grid is a table in Microsoft Word. And you have the option of coloring each cell, specifying a number between 0 and 255 for the red, green, and blue elements in RGB mode.

So I went back to random.org and generated numbers from a normal distribution with 128 (right in the middle) as the mean and 42 as the standard deviation. So the only way the numbers would go past 0 or 255 would be more than 3 standard deviations out from the mean. (With 990 numbers generated, only one did.) I’m thinking about doing it again using a standard deviation of 64, in which case there would be more variation, and you’d have more using 0 or 255.

It was interesting to do. The majority turned out to be grayish. You’d get the brightest squares when one element was very different from the other two.

colored_normal_distribution

It took a long time — I’m sure it would be fairly simple to create a program that would generate one of these charts, so maybe I’ll do that sometime in the future. I’m also thinking about doing the same thing but using the HSL color model available in Word. HSL stands for Hue, Saturation, and Lightness — but it also uses numbers 0 to 255 for each one.

Meanwhile, I feel like my intuitive grasp of the normal distribution has grown.

But mostly, I think these are pretty.

Review of Patterns of the Universe, by Alex Bellos and Edmund Harriss

patterns_of_the_universe_largePatterns of the Universe

A Coloring Adventure in Math and Beauty

by Alex Bellos and Edmund Harriss

The Experiment, New York, 2015.
Starred Review

I was going to wait until I’d colored more patterns to review this book, but now I’ve decided that having read all the text, I can tell about how fascinating it is.

Toward the end of 2015, I started hearing about the latest fad for adult coloring books. I saw this one based on math, and knew how I wanted to try participating in the fad! I asked for it for Christmas, and two of my sisters sent me a copy. That turns out to be a good thing. I’m going to color one and copy pages out of the other. I think I will copy the pi-related coloring page to give as a prize for our scavenger hunt on Super Pi Day (3/14/16). I’m also thinking about having a math coloring program at the library and using various pages, along with my own coloring sheets. (I figure copying a few pages will tantalize people into buying the book!)

The idea is wonderful: Mathematical patterns to color! There are 57 designs to simply color, and then my favorites are 12 more designs that you help create.

Some of the designs are based on Voronoi diagrams, transformations, fractals, tilings, knots, polyhedra, Fibonacci numbers, and, yes, prime numbers.

The one pattern I have already finished coloring is the Sevenn — a Venn diagram of seven sets. And coloring it made me glad I have another book from which I can make copies and try it again.

Sevenn

The later, more interesting (to me) patterns come under the section heading “Creating,” as opposed to simply “Coloring.”

This is where they have more patterns involving prime numbers and randomness, as well as cellular automata, Latin squares, and space-filling curves.

Here are the instructions for the pi-related coloring page:

PI WALK

The digits from 0 to 9 represent the directions in the key at right. Choose a color for each of them. Starting at the dot, draw a short line (about half an inch) for each of the digits in pi (given above) in the direction of that digit. So, start with the 3 color in the 3 direction, then continue from that point with a new line in the 1 direction in the 1 color, and so on.

When I looked at this section, it occurred to me that my mathematical knitting projects are an example of mathematical coloring — with yarn!

They did have a way of coloring prime numbers. Personally, I think my own way is more interesting, assigning primes a color and then coloring each multiple according to its prime factorization, whether in a grid as in my original sweater or the prime factorization blankets, or in a line in the prime factorization scarf or the prime factorization cardigan. However, the cool thing is there are quite a lot of new ideas that could be translated to knitting — and this book got my brain spinning in new ways.

It also made me realize that I could make my own coloring sheets. My knitting is coloring with yarn, and why not make these patterns available for people to try with their own colors? This book was the nudge that got me to pull out the diagrams and post them on my Sonderknitting page. I’m not an artist, so they are simply made with tables, but I think the prime factorization chart is especially helpful for learning about primes. And the prime factorization charts in other bases are helpful for understanding other bases. The Pascal’s Triangle charts show you pretty patterns from Pascal’s Triangle, and the normal distribution chart gives you a gut-level feeling for the normal distribution that’s different from what you think when you see a bell-shaped curve.

I’m looking forward to what new ideas will spark as I color the rest of the patterns in this book! And I’m also looking forward to seeing how pretty these patterns will turn out and what new insights I’ll get. It’s a win all the way around.

alexbellos.com
maxwelldemon.com

Buy from Amazon.com

Find this review on Sonderbooks at: www.sonderbooks.com/Nonfiction/patterns_of_the_universe.html

Disclosure: I am an Amazon Affiliate, and will earn a small percentage if you order a book on Amazon after clicking through from my site.

Source: This review is based on my own copy.

Disclaimer: I am a professional librarian, but I maintain my website and blogs on my own time. The views expressed are solely my own, and in no way represent the official views of my employer or of any committee or group of which I am part.

What did you think of this book?
Jade’s Finished Outliers Scarf!

Today I finished the Normal Distribution Scarf I made for my transgender daughter Jade!

OutliersScarf

This scarf shows that it is the outliers that make life beautiful.

A lot of things in life have a normal distribution — height, intelligence, and many other things. Most people are somewhere near the middle of the bell-shaped curve.

All her life, Jade has had qualities that are outliers. And I do believe that has much to do with why she is such a beautiful person. She definitely adds spice to life!

Here’s how I made the scarf:

I chose four colors of yarn. Then I generated random numbers from a normal distribution. I used the website random.org/gaussian-distributions/.

OutliersYarn

The numbers told me what colors to use for each row.

OutliersScarfLengthIf the number was negative, I knitted. If it was positive, I purled. (This will be about even for each.)

For numbers from -0.5 to 0.5, I used brown, Color A.

For numbers from -1.0 to -0.5 and 0.5 to 1.0, I used a brownish burgundy, Color B.

For numbers from -1.5 to -1.0 and 1.0 to 1.5, I used bright red, Color C.

For numbers less than -1.5 and bigger than 1.5, I used a rainbow yarn, Color D.

The rainbow yarn changed only gradually. It started out orange and gradually changed to yellow, then green, then pink. But this yarn for the outliers definitely is the most noticeable yarn throughout.

The only thing I didn’t like about this scarf is that there were far too many ends to sew in, and I didn’t feel like I did a great job of covering that up with a crocheted edging. If I make a normal distribution scarf again, I will probably knit it lengthwise, even though that won’t use as many numbers.

I was also thinking I’d like to use an additional color for 1.5 to 2.0. Then the outliers yarn would be more rare. I also might try using an amount of 0.75 for each section instead of 0.5, so that the sections would be 0 to 0.75, 0.75 to 1.5, and 1.5 to 2.25.

I’m going to test these two ideas on a coloring sheet before I try knitting another scarf.

You can find various more mathematical knitted objects and coloring sheets at sonderbooks.com/sonderknitting.

Coloring to Learn Math Concepts!

Coloring1

I’m super excited about something I’ve been working on lately — posting Mathematical Coloring Sheets on my Sonderknitting webpage.

Why Sonderknitting? Because the ideas in the coloring pages come from my mathematical knitting projects, which all began with my Prime Factorization Sweater.

PF Sweater

I wore the sweater to the library today, for our Family Math Games event. (We have lots of board games and card games that build math skills and ask only that parents play with their kids.) I also printed out some copies of the Prime Factorization Coloring Sheet — the one that matches my sweater — and brought some crayons.

A girl named Ana who is a regular at our Crazy 8s Math Club was there. She got tired of playing games with her little brother, and her Mom showed Ana the coloring sheet, and Ana became the first actual child to color one!

Ana1

I explained the idea to Ana, using my sweater as a visual aid.

There are different ways you can approach it, but what I suggested was to choose a color for 2, then color a section of every second number. Then choose a color for 3 and color a section of every third number. Then I had to explain you use the color for 2 again to color a second section in the square for 4, then give every 4th number a second section of the color for 2. Then you choose a new color for 5, and she quickly caught on that all the multiples of 5 were in columns….

Ana2

I can’t tell you how happy it made me to hear what she’d say as she was understanding how to do it (“Oh, I see!”) and seeing the patterns come out.

I think Ana’s in 2nd grade (Crazy 8s is for Kindergarten to 2nd grade.), so she can’t have studied much multiplication in school yet. So it made me all the happier to see the wheels turning and the connections forming.

But my favorite thing she said? “I like this! This is fun!”

Ana3

Review of Numbed! by David Lubar

numbed_largeNumbed!

by David Lubar

Millbrook Press, 2013. 144 pages.
2015 Mathical Honor Book

I read this book while waiting for the Metro on the way to the National Book Festival – where I got to meet the author at the Mathical booth! I already knew I enjoy his sense of humor because of his Twitter posts as well as his writing, and I’m happy that he turned toward numbers with this book.

In Numbed!, the kids from Punished! get into new trouble at the Math Museum. They go into an experimental area where they’re not supposed to go, and an angry robot zaps them so they’re numbed. First they can’t do any math at all; when they fix that (by solving a problem in the matheteria, where a special “field” helps them), they can only do addition and subtraction, but not multiplication and division. When they fix that, they still can’t do word problems or apply mathematical reasoning to anything.

Now, as a math person, I really have to work hard at suspending disbelief for this story! Multiplication is repeated addition, so the idea that the kids would be able to add and subtract but not multiply didn’t work for me. Of course, the kids figured that out – that was how they got around the problem. But that areas of math are so distinct? No, I couldn’t quite handle that! And then the hand-waving involved in the robot being able to “numb” them and the matheteria having a “field” making it easier to do math problems? Aaugh!

But I really wanted to like the book. It won a Mathical Honor! And I like the author! So let’s point out all the good things about it. First, I do like the characters – boys who can’t stay out of trouble. At the start of the book, they don’t see what math is good for – and they definitely find out it’s good for many, many things when they lose the ability to do it.

I really enjoyed the high-level problems the boys had to solve to break their curse. The boys applied creative reasoning, and the problems and solutions were all explained clearly – and we believed that the boys could figure them out, at least in the enhanced “field.”

In general? The premise was a little hard for me to get past – but in practice, the book was a whole lot of fun. It’s also a quick read – I only read it while I was waiting for the Metro, not while the Metro was moving, and finished the whole thing on National Book Festival day.

Punished! has been very popular with kids in our county. I hope they’ll also find out about Numbed!. A silly school story – with math!

davidlubar.com
millbrookpress.com

Buy from Amazon.com

Find this review on Sonderbooks at: www.sonderbooks.com/Childrens_Fiction/numbed.html

Disclosure: I am an Amazon Affiliate, and will earn a small percentage if you order a book on Amazon after clicking through from my site.

Source: This review is based on a library book from Fairfax County Public Library.

Disclaimer: I am a professional librarian, but I maintain my website and blogs on my own time. The views expressed are solely my own, and in no way represent the official views of my employer or of any committee or group of which I am part.

What did you think of this book?
Zoe’s Prime Factorization Blanket!

Back in November, I finished my little niece Zoe’s Prime Factorization Blanket!

PFBlanket2

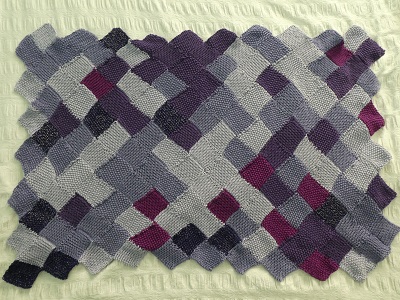
What is a Prime Factorization Blanket? Why, a blanket that shows the prime factorization of all the whole numbers up to 99, using a color for each prime number.

This is the same set-up as my niece Arianna’s Prime Factorization Blanket, as a matter of fact. But I used new colors for Zoe’s blanket, going with a lot of pink, because we already knew she was going to be a girl. (With Arianna, we found out she’d be a girl right when I got to the number 17, so in that blanket 17 is pink.)

The blankets don’t really need a pattern, but here are the specifications: I used Tahki Cotton Classic yarn, because it has so many shades available. Each square is a garter stitch square with 12 ridges and 12 stitches, which is easy to divide in 2, 3, 4, or 6 sections. For 5 sections, I did a plain row at the beginning and end. It’s done in entrelac, so you go across and knit the square for each number individually, then go back making the white squares, then do the next row of numbers, then a row of white. It’s much nicer than making the original sweater, because you can work on one number at a time, and don’t have to carry yarn across.

Here is Zoe’s Prime Factorization Blanket laid out flat (or sort of flat):

Zoes Blanket

Here’s how it works. Starting in the bottom left corner (because graphs always have the origin in the bottom left), there’s a missing space for zero. Then 1 is pale pink, the background color:

Zoes Blanket bottom left

2 was assigned the color pink.
3 was assigned the color red.

Zoes Blanket bottom middle

4 is our first composite number, 2 x 2. So I used two sections of pink. (If you look at the actual blanket, you can tell there are two sections, but it’s harder to tell in the picture.)
5 is prime, so it’s assigned a new color, yellow.
6 is composite, 2 x 3. So it gets a section of pink and a section of red.

Zoes Blanket bottom right

7 is prime, so it gets a new color, purple.
8 is composite, 2 x 2 x 2. Three sections of pink.
9 = 3 x 3, so it gets two sections of red.

New row, so look back at the photo of the bottom right.
10 = 2 x 5, so it gets a section of pink and a section of yellow.
11 is prime, so it gets a new color, turquoise.
12 = 2 x 2 x 3, so two sections of pink and one section of red.
13 is prime, so it gets a new color, sea foam green.

Now the picture for the middle:
14 = 2 x 7, so pink and purple.
15 = 3 x 5, so red and yellow.
16 = 2 x 2 x 2 x 2, so four sections of pink.

Now the picture of the right side:
17 is prime, so it gets a new color, baby blue.
18 = 2 x 3 x 3, one section of pink, two sections of red.
19 is prime, so it gets a new color, olive green.

The next row starts at 20. The blanket goes all the way up to 99.

Here’s the top corner, so you can see some bigger numbers:

Zoes Blanket top corner

You can see the patterns nicely in the grid of the blankets. As an example of some simple patterns, the twos and fives line up in straight lines, but so do the elevens, in a diagonal line. There are lots more patterns which you can find the more you look at the blanket.

And Zoe likes it!

ZoeandBlanket

I’m gathering all my Mathematical Knitting links on my Sonderknitting page. (I hope to soon add coloring pages, too!) Check out the rest!